Data Mining Workspace Sensors: A New Approach to Anthropology
UDC: 003.295:572+316.7
IZVLEČEK
Podatkovno rudarjenje senzorjev v delovnem okolju: nov pristop k antropologiji
1Antropologija po nepotrebnem zaostaja pri vključevanju računskih metod v raziskave, čeprav te postajajo vse bolj priljubljene v družboslovju in humanistiki. Tudi v antropologiji namreč uspešno združujemo kvantitativne in kvalitativne metode, še posebej kadar prehajamo med njimi. V prispevku predlagamo nov metodološki pristop in opišemo, kako smo uporabili kvantitativne metode in podatkovno analitiko v etnografskem raziskovalnem delu. Metodologijo prikažemo na primeru analize senzorskih podatkov ene od fakultetnih stavb Univerze v Ljubljani, kjer smo opazovali prakse in vedenje zaposlenih med delovnim časom in ugotavljali, kako upravljajo s stavbo in bivalnim okoljem. Za raziskovanje smo na primeru t.i. »pametne stavbe« uporabili krožne mešane metode, ki prepletajo podatkovno analitiko (kvantitativni pristop) z etnografijo (kvalitativni pristop), ter sočasno empirično identificirali glavne prednosti nove antropološke metodologije.
2Ključne besede: računska antropologija, senzorski podatki, podatkovna etnografija, krožne mešane metode
ABSTRACT
1While social sciences and humanities are increasingly including computational methods in their research, anthropology seems to be lagging behind. But it does not have to be so. Anthropology is able to merge quantitative and qualitative methods successfully, especially when traversing between the two. In the following contribution, we propose a new methodological approach and describe how to engage quantitative methods and data analysis to support ethnographic research. We showcase this methodology with the analysis of sensor data from a University of Ljubljana’s faculty building, where we observed human practices and behaviours of employees during working hours and analysed how they interact with the building and their environment. We applied the proposed circular mixed methods approach that combines data analysis (quantitative approach) with ethnography (qualitative approach) on an example of a “smart building” and empirically identified the main benefits of the new anthropological methodology.
2Keywords: computational anthropology, sensor data, data ethnography, circular mixed methods
1. Introduction
1Social sciences and humanities are rapidly adopting computational approaches and software tools, resulting in an emerging field of digital humanities (Klein and Gold 2016) and computational social sciences (Conte et al. 2012). Among these is anthropology, which is particularly suitable for traversing between quantitative and qualitative methods. Anthropologists study and analyse human habits, practices, behaviours and cultures, with a particular focus on participant observation and long-term fieldwork as a methodological cornerstone of the discipline. With an increasing availability of data coming from social networks and wearable devices among other sources (Miller et al. 2016; Gershenfeld and Vasseur 2014), anthropologists can easier than ever dive into data analysis and study humans and their societies, subcultures and cultures quantitatively as well as qualitatively.
2With this contribution, we tentatively place anthropology in the field of digital humanities,1 mostly because the suggested approach is multidisciplinary and by analogy similar to the shifts between distant and close reading (Jänicke et al. 2015) in literary studies. Just like distant reading can offer an abstract (over)view of the corpus, quantitative analyses can give a researcher a broad understanding of the population she is investigating. And just like distant reading needs close reading to understand the style, themes, and subtle meanings of a literary work, so does data analysis need an ethnographic approach to contextualize the information and extract subtle meanings of individual human experience.
3As Pink et al. (2017) suggest, there is value in investigating everyday data that reveal what is ordinary, what extraordinary and how to contextualize the two. In this contribution we expand the idea by employing the circular mixed methods approach that combines qualitative research from anthropology and quantitative analysis from data mining. We consider the mixed methods (Creswell and Clark 2007; Teddlie and Tashakkori 2009) as an integrative research that merges data collection, methods of research and philosophical issues from both quantitative and qualitative research paradigms into a singular framework (Johnson et al. 2007). We also stress the need for a circular research design, where we traverse between methods to continually verify and enhance knowledge. Circularity gives research flexibility and enables shifting perspectives in response to new information.
4Our study, which provides the basis for this article, began in October 2017 and includes 14 offices at one of the University of Ljubljana’s faculty buildings. The building is equipped with automation systems and sensors measuring large amounts of data related mostly to the building’s energy performance and thermal comfort. We retrieved measurements from approximately 20 sensors from the SCADA monitoring system for the year 2016 and extrapolated behavioural patterns for different rooms and, more generally, room types through data visualization and exploratory analysis. The analysis showed specific patterns emerging in several rooms; we noticed there were some definite outliers in terms of working hours and room interaction.
5We used computational methods to gauge new perspectives on human behaviour and invoke potentially relevant hypotheses. Data analysis provided several distinct patterns of behaviour and defined the baseline for workspace use. However, this approach was unable to provide us with a context for the data. Quantitative methods can easily answer the ‘what’, ‘where’ and ‘when’ type of questions, but struggle with the ‘why’. At that stage, we employed anthropological fieldwork and ethnography as the main methods of anthropology. We conducted interviews with room occupants to explain what the uncovered patterns mean and why people behave the way they do.
6The main purpose of our study was to demonstrate how anthropologists can use statistics and data visualisation to establish the essential facts of the observed phenomena and how the traditional anthropological methods, which have not significantly changed since the early 20th century, when Malinowski (2002 [1922]) carried out his ground-breaking ethnographic research at the Trobriand Islands, can be complemented and upgraded by data analysis. We call this a circular mixed methods approach, where circular implies continual traversing between qualitative and quantitative methods, between fieldwork and data analysis. Our research applies the proposed methodology to sensor data obtained from a smart building and with a combination of data mining and ethnographic field establishes both a wide and deep understanding of human behaviour in a workplace setting.
7While inclusion of domain experts is already a postulate in machine learning and data mining, the opposite, the inclusion of machine learning and data mining in anthropology, is fairly new and lacks sufficient practical application. Concurrently, few anthropologists and even social scientists and humanists in general are included in the development of AI solutions and data analysis, even when the data is strictly coming from a social domain (Skeem and Lowenkamp 2016; Lum and Isaac 2016; see also Pretnar and Robnik-Šikonja 2019). Moreover, the plot twist in anthropology comes from the fact that anthropologists do not act as domain experts explaining the data, but as channels and interpreters for the people to explain the data they produced themselves. In anthropology, authority does not come from the researcher, but from the researched – the group of people that are the source of data and information.
2. Development of Computational Anthropology
1While digital humanities became a full-fledged field in the last couple of decades (Hockey 2004), anthropology seems to be lagging behind. Some authors suggest anthropology should be more concerned with digital as an object of analysis rather than as a tool (Svensson 2010). However, there have been several attempts to include computational methods and quantitative analyses into anthropological research. Already in the 1960s, anthropologists looked at using computers for the organisation of anthropological data and field notes (Kuzara et al. 1966; Podolefsky and McCarty 1983) and started using computers for social network analysis (Mitchell 1974). Progress in text analysis, coding facts, and comparative studies in linguistics (Dobbert et al. 1984; White and Truex 1988) followed suit.
2However, only lately has there been a significant computational breakthrough in the discipline. Digital anthropology turned disciplinary attention to the analysis of online worlds, virtual identities, and human relationships with technology. For example, Bell (2006) gave a cultural interpretation of the use of ICTs in South and Southeast Asia, Boellstorff (2015) investigated online worlds in the Second Life, Nardi (2010) explored gaming behaviour of the World of Warcraft, and Bonilla and Rosa (2015) described how to use hashtags for ethnographic research. Moreover, a discussion has been opened on what does ‘big data’ mean for social sciences and how to ethically address its retrieval and analysis (boyd and Crawford 2012; Mittelstadt et al. 2016).
3There was a discussion on the methodological front as well. Anderson et al. (2009) argue for a method that combines the ethos of ethnography with database mining techniques, something the authors call ‘ethno-mining’. Similarly, Blok and Pedersen (2014) look at the intersection of ‘big’ and ‘small’ data to produce ‘thick’ data and include research subjects as co-producers of knowledge about themselves (see also Hsu 2014). Finally, Krieg et al. (2017) not only elaborate on the usefulness of algorithms for ethnographic fieldwork, but also show in detail how to conduct such research in an example of online reports of drug experiences.
3. Anthropology vs. Data Analysis
1For an anthropologist, statistical and computational analysis is not the first thing that comes to mind when developing research design and methodology. Anthropologists are trained to observe phenomena in the field, talk to people, spend time with them, participate in daily activities, and immerse themselves in research topics (Kawulich 2005; Marcus 2007). This type of information gives us detailed stories of human lives, uncovers meanings behind rituals, habits, languages, and relationships, and provides a coherent explanation of the researched phenomena. So why would anthropologists even have to include data analysis in their studies? Why and when is such an approach relevant?
2Sometimes, the phenomena that anthropologists are trying to explain occur in different places at the same time and are impossible to observe simultaneously. It could be that anthropologists know little of the topic they are exploring and have yet to generate their research questions. Alternatively, the nature of the phenomenon lends itself nicely to computational analysis. For example, behaviour of many individuals is difficult to observe in real time, especially if we want to observe them at once in different locations. Sensors, on the other hand, can track behaviours of these individuals independently (Patel et al. 2012) and therefore enable a detailed comparative analysis. With a large number of measurements, researchers can also observe seasonal variations, similarity of users, and changes through time.
3Data analysis also helps us define the parameters of a research field and establish what is ordinary and what extraordinary behaviour. Visualisations in particular are excellent tools for exploring and understanding frequent patterns of behaviour and outliers. When done well, visualisations harness the perceptual abilities of humans to provide visual insights into data (Fayyad et al. 2002, 4). Moreover, they provide a new perspective on a phenomenon and help generate research questions and hypotheses. Once we know how research participants behave (or communicate if we are observing textual documents or establish social ties if we are observing social networks), we can enter the field equipped with knowledge and information to verify and contextualise.
4Finally, large data sets are particularly appropriate for computational analysis. While ‘big data’ became a popular buzzword in data science, anthropologists most likely will not be dealing with millions of data points that can be analysed only with graphics processing units (GPUs). However, even ten thousand observations are too much for a researcher to make sense of. For such data, we need software tools and visualisations, which provide an overview of the phenomenon, plot typical patterns, and enable exploring different sub-populations.
4. Data Ethics and Surveillance Technologies
1Computational anthropology does not encompass only methodological approaches for data analysis, epistemological questions on the relationship of human being towards technology, and empirical research with computational methods, but also ethics on data storage, processing, analysis and dissemination. In a broad sense, it includes three axes of ethics, namely the ethics of data, the ethics of algorithms, and ethics of practices (Floridi and Taddeo 2016). In this contribution, we mostly touch upon the final one, the ethics of practices.
2Research ethics, in particular sensitivity to the potential harm a study could elicit, is one of the core questions of anthropology, which is deeply immersed in the personal human experience. First, a solid deontological paradigm is crucial for working with not only sensitive data but any human-produced data. In this sense, we follow the principles of positivist ethics which call for human dignity, autonomy, protection, maximizing benefits and minimizing harm, respect, and justice (Markham et al. 2012; Halford 2017). In other words, anthropologists should act in the best interest of the research participants and avoid or minimize negative effects the study could have on the people.
3Secondly, anthropologists should be mindful of the potential subjectivity of their interpretation of the data. Every data set, whether quantitative or qualitative, elicits interpretation that inevitably stems from our own world-view. To keep the bias to a minimum, the suggested circular mixed methods approach, proposed in this article, as well as most others approaches with origins in anthropology strive for continual reinterpretation of the results within the actual social context of research participants. Each ethnographic layer explains the results from the point of view of data producers and thus minimizes the chance of bias and misinterpretation.
4Sensors and wearable devices inevitably invoke questions of surveillance and privacy. Here, we propose a distinction between surveillance and monitoring. Surveillance implies guiding actions of surveilled subjects, while monitoring proposes a more passive stance of observing behaviour (see Marx 2002; Nolan 2018). The present study was not designed to guide behaviour but to observe and understand, hence being more monitoring than surveillance focused. And even if we consider it surveillance-like, Marx proposes “a broad comparative measure of surveillance slack which considers the extent to which a technology is applied, rather than the absolute amount of surveillance” (Marx 2002), meaning that the extent to which surveillance is harmful is the power it holds for the user. The case of sensor data of a smart building that monitors only neutral human behaviour, falls to the soft side of power, which, in the opinion of the authors, deserves some surveillance slack. Nevertheless, we strived to uphold high ethical standards for handling the data and disseminating the results, mostly by employing “ongoing consensual decision-making” (Ramos 1989) by informing participants of the purpose of the research, which data are being collected and how the findings are going to be presented.
5. Circular Mixed Methods
1Circularity in machine learning and data mining is not a novel idea. Data science methodology already includes ideas about circular phases of data mining (CRISP-DM, Shearer 2000), where phases are interdependent and by reiterating through them the analyst clarifies existing and generates new business questions. However, not much has been written yet alone put to practice in terms of interdisciplinary circularity and the intertwining of methods from different scientific fields (for some pioneering efforts see above).
2For the purpose of our study, we designed a novel methodological approach, named it circular mixed methods, and employed it to analyse the workspace behaviour and practices of employees. This approach aims to observe the phenomenon from several different perspectives. Nominally, we have split these perspectives into several research stages, where we use a single method, but in reality these methods are used interchangeably and in accordance with each particular situation. For the sake of clarity, however, we will refer to the four stages of research.
3The first stage involved gathering historical longitudinal data from the building’s sensors. We used unsupervised data mining and exploratory data analysis to uncover behavioural patterns, identify interesting individuals (outliers) and form several hypotheses about the use of spaces and energy consumption in the building.
4The second stage involved in-depth ethnographic research, where we used interviews, questionnaires, focus groups, and, most importantly, participant observation from a three-year period of working in the mentioned building. This part helped us clarify the context of particular behaviours, identified the values, motivations and deterring factors of each research participant, and confirmed or rejected hypotheses.
5In the third stage, which is currently in process, we use text mining methods on interview transcripts to find common topics, observe sentiment towards particular issues, and determine which individuals have similar opinions on certain topics. This is still a work-in-progress and the results might even be negative – since this is the first application of text mining on ethnographic interview transcripts, we still need to estimate the viability of such an approach for anthropology. The size of the corpus in anthropology is normally small and it is entirely possible there is no added value to text mining such data. Finally, we conclude with another round of ethnography, conducting the second round of interviews (normally a year after the first one) and verifying the results from the third stage.
6As mentioned before, the distinction between each particular stage is not always strict. Circular mixed methods aim to provide the researcher with the freedom she needs to address complex phenomena from several different perspectives. There can be several alternating stages, where each stage contributes another interpretative layer to the previously established facts.
7There are plenty of benefits of this approach. Circular mixed methods are particularly appropriate for uncovering intricate longitudinal patterns, which are incredibly challenging for the researcher to observe at such granularity. Moreover, this method can be used for observing diachronic phenomena, where the data comes from several locations at once, hence overcoming the physical limitations of a single researcher. Finally, researchers can effectively and rapidly analyse large data collections with computational means. Some such collections are interesting for anthropologists as well, namely social media, archival data, wearables, sensors or audio-visual recordings. Visualisations, one of the product of data mining, substantiate the findings and enable researchers to uncover relations, patterns and outliers in the data. Data analysis can thus help generate hypotheses and questions for the research. This cuts down the time required to get familiar with the field. A researcher can come into the field equipped with potentially interesting hypotheses and test them almost immediately.
8Looking at the data alone, however, we would be unable to determine what any of those patterns and outliers mean. To truly understand them, we need to immerse ourselves in the field, ask questions and observe how people behave and create their habits and practices. While quantitative analysis provides us with clues, qualitative approaches, such as ethnography and fieldwork, explain those clues and substantiate the superficial knowledge of the field acquired in the first and third research phase. Metaphorically speaking, data analysis is great for scratching the surface and ethnography excels at digging deeper. By combining the two approaches, however, we can interpret the data in a rich and meaningful way, as we will show with the case study presented in the article.
6. Data Preprocessing
1In our study, we have observed sensor measurements from a faculty building which is considered to be a state-of-the-art smart building in Slovenia. Each room in the building is equipped with a temperature sensor and sensors on windows that track when they are open or closed. Doors have electronic key locks that track when the room is occupied. There were altogether 11 sensor measurements, with additional 8 measurements coming from the weather station located on the building’s rooftop. In-room sensor reports the room temperature, set temperature, ventilation speed, daily regime, and so on, while the weather station reports the external temperature, light, rainfall, etc.
2One of the most important measures is the daily regime, which has four values, each representing a state of the overall room setting. When a person is present in the room, the regime is comfort (value = 0) and when a window is open, the regime is off (value = 4). If the room is vacant, the regime goes to night (value = 1) or standby (value = 3).2 These measurements come from electronic locks on the doors, which record when the room is occupied, and the magnets in windows, which record when the window is open.
3We retrieved 55,456 recordings for 14 rooms of different types, namely 5 laboratories, 6 cabinets, and 3 administration rooms. Measurements are recorded bi-hourly and stored in SCADA, a software that allows controlling processes locally or at remote locations, monitoring and processing real-time data, interacting with devices, and recording events into a log file.
4We decided to observe the year 2016 and later compare it to 2017. The results in the paper refer only to 2016. The rooms are anonymised to ensure data privacy and results for two of the rooms are not reported at the request of their occupants.
| Date | Room temperature | Daily regime | Room |
|---|---|---|---|
| 2016-01-01 02:10:00 | 20.94266 | 1 | C |
| 2016-01-01 02:10:00 | 21.65854 | 1 | B |
| 2016-01-01 02:10:00 | 20.63234 | 1 | K |
| 2016-01-01 02:10:00 | 22.41270 | 1 | D |
| 2016-01-01 02:10:00 | 20.25890 | 1 | M |
| 2016-01-01 02:10:00 | 21.45220 | 3 | C |
5We performed extensive data cleaning and preprocessing and removed data points with missing values (Table 1). The daily regime was considered the most important variable since it reports a presence in the room or the opening of windows. Concurrently, we retained only the variables reporting the daily regime, since this feature registered human behaviour the best, and room temperature. We also generated additional features, such as the day of the week and room type (cabinet, laboratory, and administration).
| Date | 0 am | 1 am | 2 am | 3 am | … | Room | Day | Type |
|---|---|---|---|---|---|---|---|---|
| 2016-01-01 | 0 | 1 | 1 | 0 | … | C | Fri | laboratory |
| 2016-01-01 | 0 | 0 | 0 | 0 | … | B | Fri | laboratory |
| 2016-01-01 | 0 | 0 | 1 | 1 | … | K | Fri | administration |
| 2016-01-01 | 0 | 0 | 0 | 1 | … | D | Fri | cabinet |
| 2016-01-01 | 0 | 1 | 1 | 1 | … | M | Fri | administration |
| 2016-01-02 | 0 | 0 | 1 | 1 | … | C | Sat | laboratory |
6In the second part of the analysis, we created a transformed data set where we merged daily readings for a room into one ‘daily behaviour’ vector (Table 2). In the new data set, each room has a daily recording, where the new features are values of the daily regime at each hour. Since sensors only record the state every two hours, we filled missing values with the previously observed state. For example, if the original vector was {0, ?, 0, ?, 1, ?, 1}, we imputed missing values to get {0, 0, 0, 0, 1, 1, 1}. As we were interested only in the presence in the room, we put 0 where daily regime was 1 (night) or 3 (standby) and 1 where it was 0 (comfort) or 4 (window open), discarding the information on specific temperature regimes. This gave us the final daily behaviour vector which we could compare in time and between rooms.
7To sum up, we were working with two data sets, the first reporting the presence of people in the room for a given time (11 features from room sensors) and the second one showing the behaviour of the room throughout the day (24 features on room occupancy at each hour).
7. Results
1First, we wanted to see how rooms differ by room occupancy alone. We hypothesised there will be a significant difference in occupancy between laboratories and cabinets since the presence of more people in a space extends the occupancy hours (no complete overlap of working time). We took the first data set with bi-hourly recordings and removed readings where the daily regime was either 1 (night) or 3 (standby) because these readings indicate the room was not occupied. Afterwards, we computed the contingency matrix of room occupancy by the day of the week, which shows how many times per year a room was occupied on a certain day. We visualised the result in a line plot by the type of the room (Figure 1). We can notice that laboratories have a higher presence on Saturday and Sunday than the other rooms.
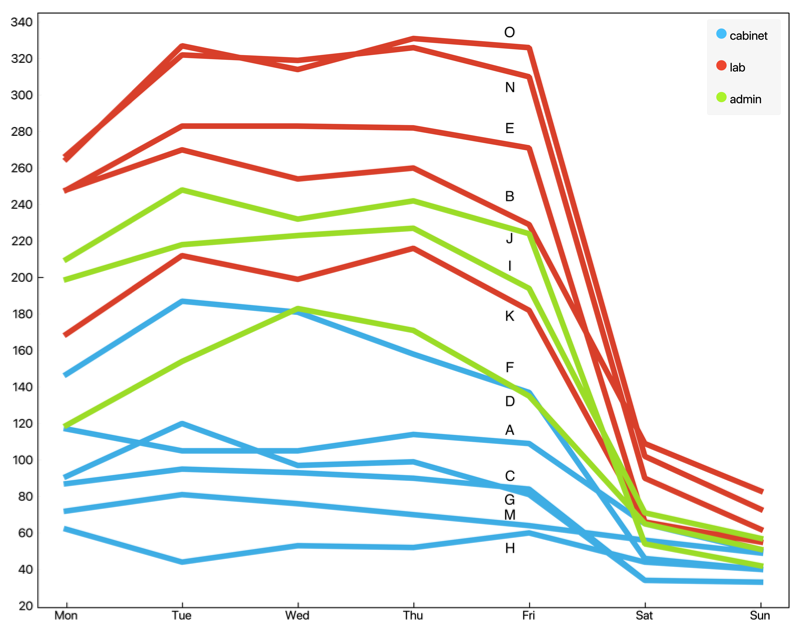
1Source: Author data displayed in the software Orange.
2Moreover, N and O are the top two rooms by occupancy. We know that these two rooms belong to a single laboratory and are separated with a permanently open door. These two rooms are occupied by the largest number of people and since the employees of the faculty have a somewhat flexible working time, the dispersion of working time is expectedly the highest in rooms with the most occupants (smallest overlap in working time among employees). N and O are also among the few rooms where occupancy goes up towards the end of the week.
3F and B are also laboratories, both displaying similarly high presence across the week. On the bottom of the plot there are cabinets, namely G, K, F. Unsurprisingly, cabinets display lower occupancy rates than laboratories, since cabinets are used by a single person and hence no overlap is possible. They are also functional rooms, used predominantly for meetings, office hours, and other intermittent work of professors.
4With the second room occupancy data set, we made an analysis of behavioural patterns by the time of the day. We observed occupancy by room type in a heat map where 1 (yellow) means presence and 0 (blue) absence. Visualisation in Figure 2 is simplified by merging similar rows with k-means (k=50) and clustering by similarity (Euclidean distance, average linkage, and optimal leaf ordering). Such simplification joins identical or highly similar patterns into one row and rearranges them so that similar rows are put closer together.
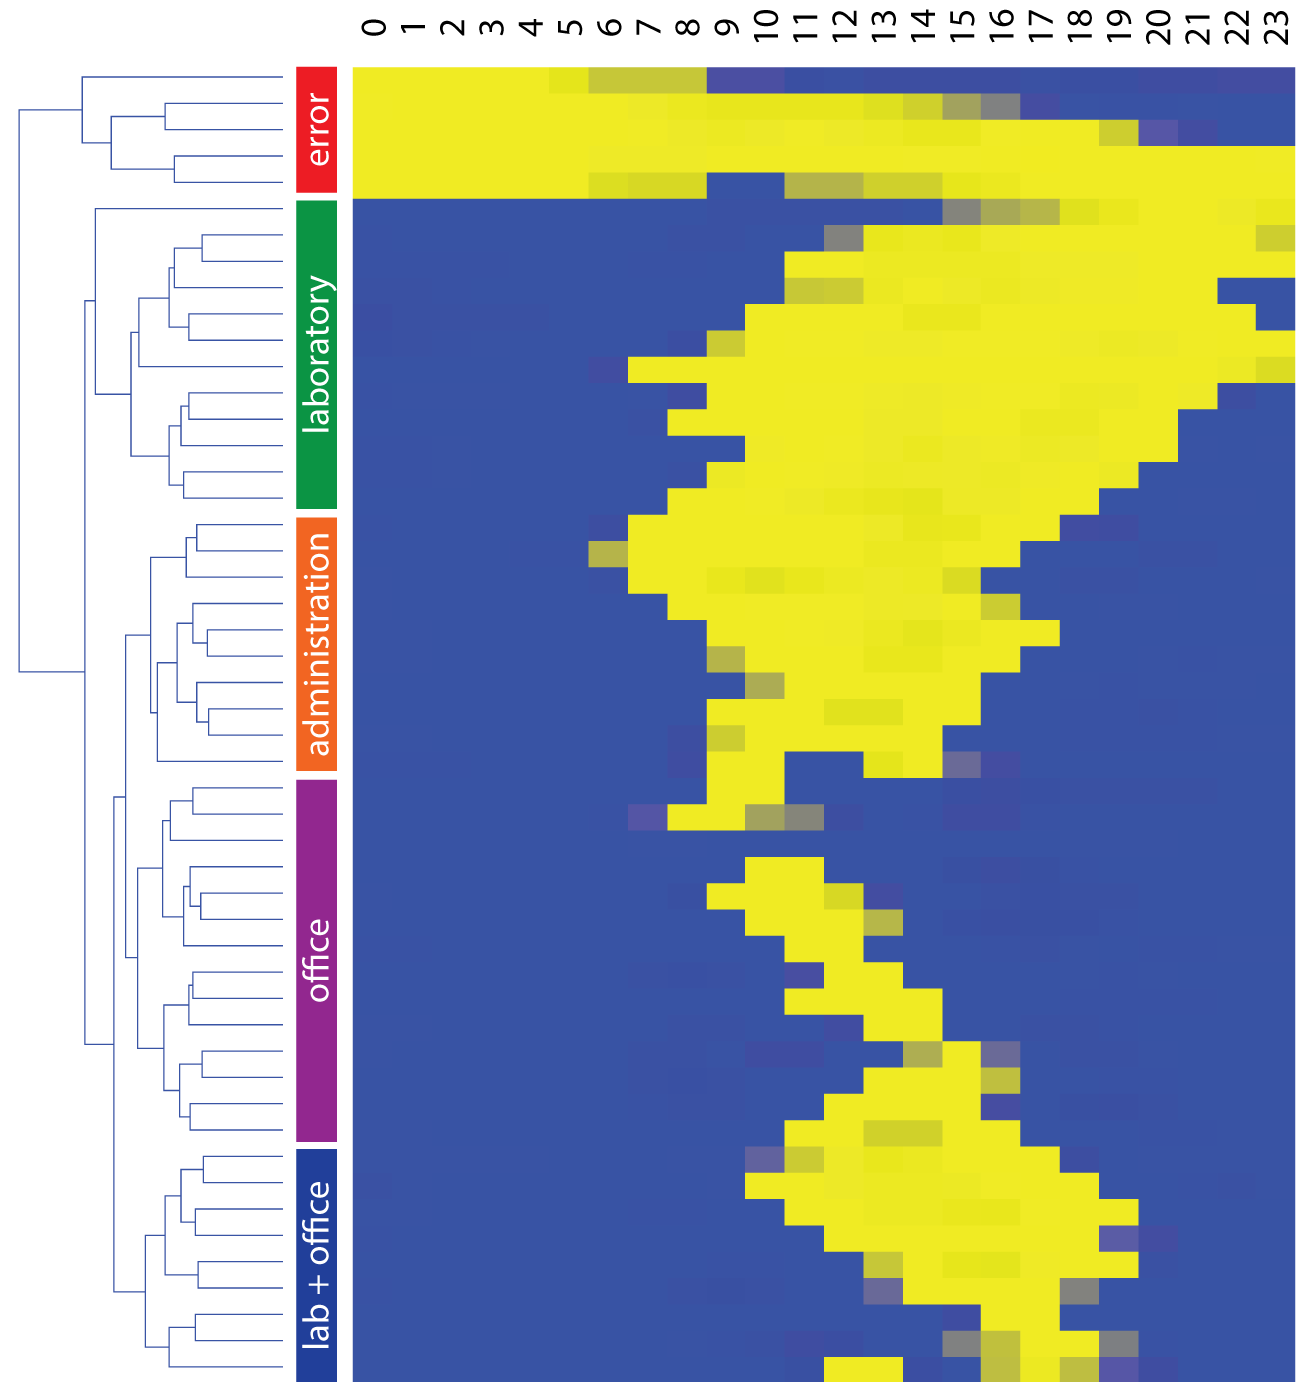
1Source: Author data displayed in the software Orange.
5Clustering revealed that occupancy sequence highly depends on the room type. There were some error data, where sensors recorded presence at unusual hours (for example during the night consistently across all rooms). But despite some noise in our data, we can distinguish between typical laboratory, administration and cabinet behaviour, since our error data constitute a separate cluster (Dave 1991). Cabinets again show the lowest occupancy with presence recorded sporadically across the day. Normally, university lecturers spend a large portion of their time in lecture rooms and in their respective laboratories. This is why occupancy of cabinets is so erratic and does not display a consistent pattern. Laboratory occupants, on the other hand, usually come late and stay late, while administration staff work regularly from 7:00 a.m. to 4:00 p.m. They both display fairly consistent behaviour.
6We visualised the same data set in a line plot, which shows the frequency of attributes on a line. In this way, we can better observe the differences between individual rooms at each time of the day and where specific peaks (high frequencies) happen. Figure 3 displays the occupancy ratio at a specific time of day, while Figure 4 shows the ratio of window opening.3 Several interesting observations emerge. In both cases, room O is skewed to the right, meaning its occupants work at late hours and open windows while working. Conversely, room J is skewed to the right, indicating its occupants start work earlier than most. There is also a distinct peak in window opening at around lunch time.
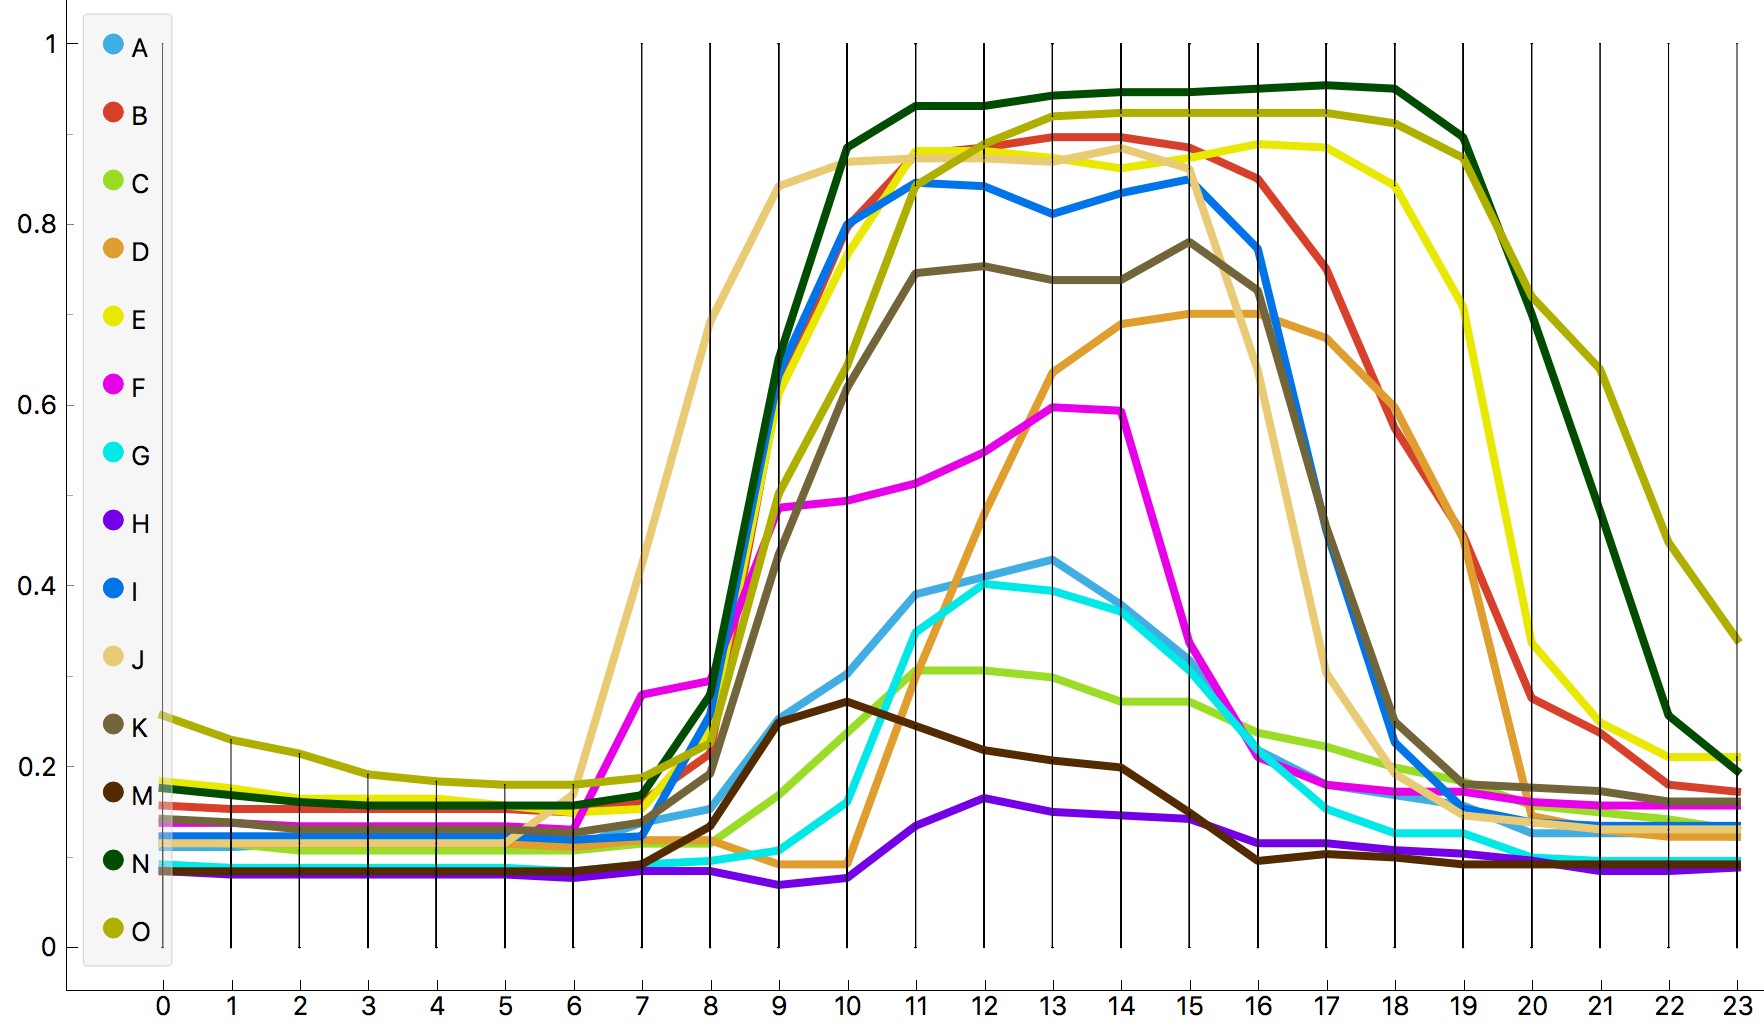
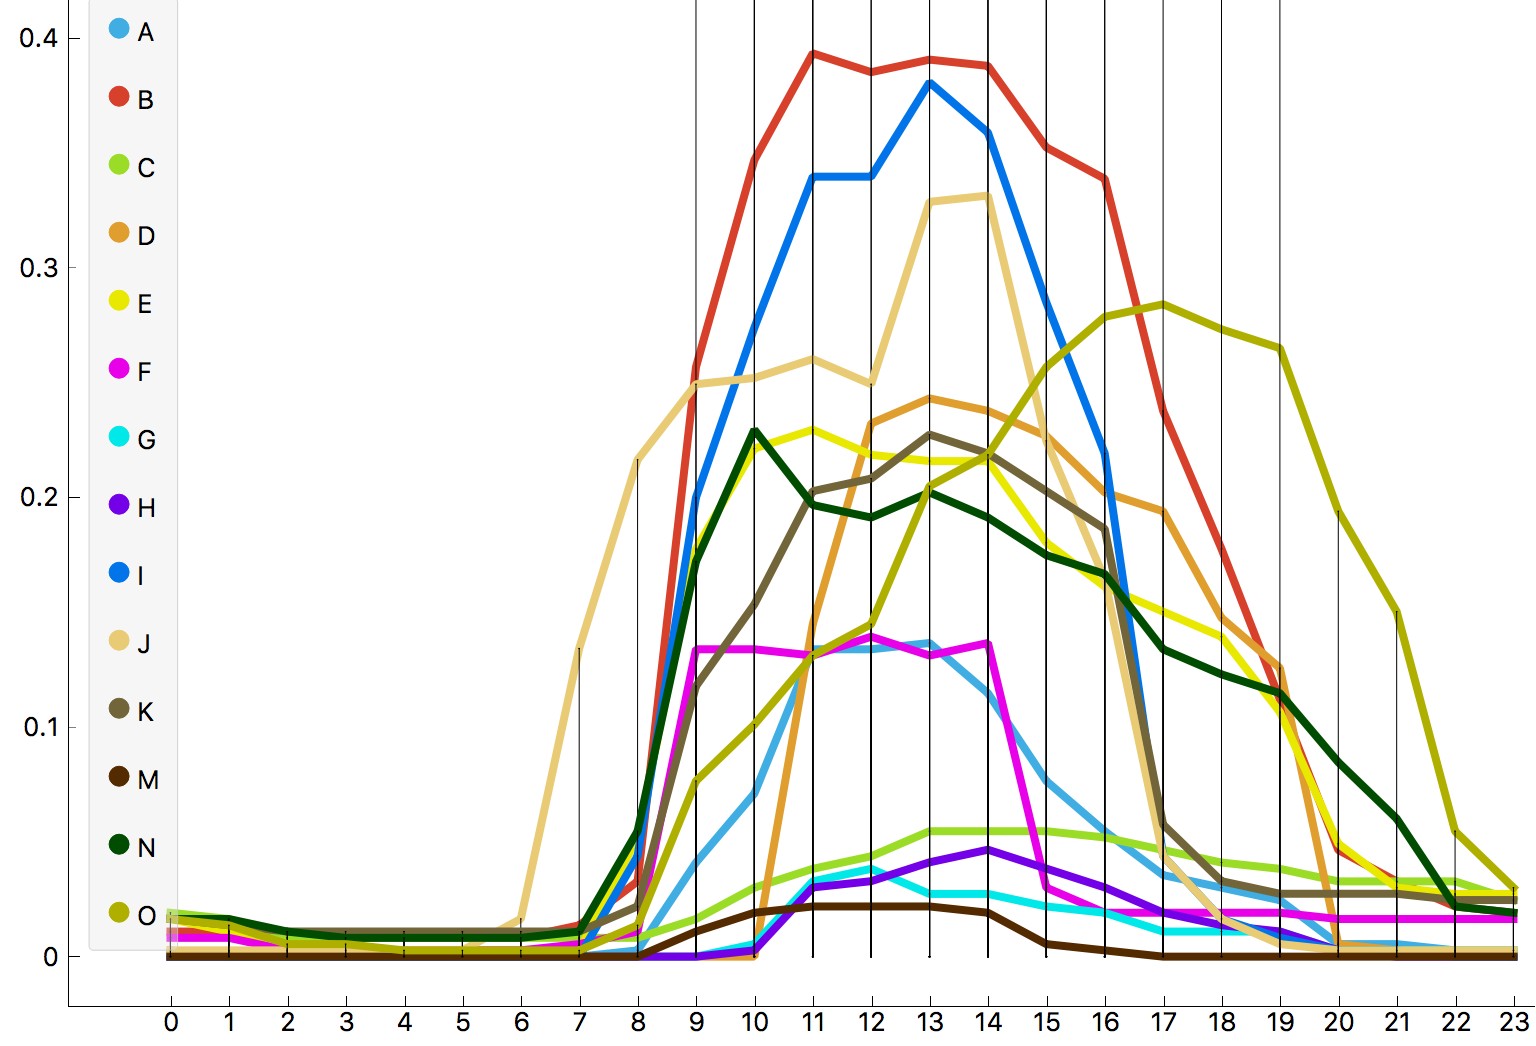
7In most rooms, people are opening windows from late morning to early afternoon. Again, not surprising, considering this is their peak working time. This is a great indicator for an ethnographer if he or she wants to observe windows interaction (who does it, is there a consensus on whether or not it should be opened, does this happen more frequently after lunch...). Looking at the data, the best time for observing the specified behaviour is between 10:00 a.m. and 1:00 p.m. Accordingly, data analysis can also serve as a guide for ethnographic fieldwork.
8. Ethnography Comes In
1Data analysis revealed some interesting patterns in the use of working spaces:
- laboratories work more on the weekends,
- rooms N and O work late,
- room J starts the day early and opens the windows at lunchtime, and
- in rooms H, N and O the occupancy goes up towards the end of the week.
2How can we explain this? While the data gave us clues, the answers lie with the people. Substantiating analytical findings with fieldwork ethnography is crucial for understanding the data. We conducted semi-structured interviews with the rooms’ occupants to discover what those patterns mean and why a certain behaviour occurs.
3Laboratories have a higher weekend occupancy since they offer a quiet place to work for PhD students who are either catching deadlines for publishing papers or using their ‘off time’ for some in-depth research. Room B, in particular, seems to like working at weekends and we were able to identify an individual who often comes to work on Saturdays. In the interview, he4 told us this was the time when he finally managed to do some actual work: “Effectively, if you look at the duration of my focus, it is much longer during the weekends. In my opinion, I do a day and a half worth of work during the weekend compared to the weekday.”
4Rooms N and O are quite similar in terms of presence although room N displays a tendency to work the latest. By observing the inhabitants in this room and talking to them, we identified an individual who preferred to work in the late afternoon and evening. Since, as mentioned above, working time is flexible at the studied faculty, he adjusted his working hours to suit his preferences. He also prefers fresh air to artificial ventilation and opens the windows whenever possible. This accounts for the skew to the right for room O in Figure 4. “I like fresh air,” he told us. “The air outside is always better than the air inside. I opened my window at every chance, even during the winter.”
5The increased productivity in rooms N, O, and H towards the end of the week is explained by the fact that Fridays are working sprints for the occupants of these three rooms. The case of room H is particularly interesting. This is the room with the overall lowest occupancy, yet the room is most frequented on Fridays, unlike in most other rooms, where the occupancy decreases towards the end of the week. Room H is the cabinet of a professor who runs laboratories N and O. He is also a part of the Friday development sprints, hence the peak. Yet he is very sociable and prefers to work in the laboratory with colleagues, rather than alone in the cabinet, as was evident from our observation and discussion with him. This also explains the overall low and erratic occupancy of his room during the rest of the week.
6The skewed peak for room J in Figure 3 is also interesting. The occupant of this room admitted he prefers coming to work earlier to make the most of the day. He stressed several times that daylight is important to him and by shifting working time to earlier hours, he was able to leave early and use the rest of the day for himself. He also said he was the most productive in early mornings since these were the quietest parts of the day. In his words:“[I like coming early] because I have more of the day left in my private life. It is also quiet in the morning and I can do more work.”
7Personal preferences evidently affected the discovered patterns of workday behaviour. In summary, people working in the researched building adjust their working hours and their environment to suit their personal needs, values, and lifestyle. Designing a single solution for such a diverse group not only invokes dissatisfaction among occupants, but leads to lower productivity, higher stress, improvised DIY solutions, and ultimately to higher energy consumption and worse workspace health.
9. Conclusion
1In this paper, we have shown how anthropological (qualitative) research methods can be enriched, upgraded, and substantiated by data analysis. While the findings are still preliminary and based on a limited sample, they nevertheless pinpoint aspects of data analysis that benefit from ethnographic insight and vice versa.
2With the increasing availability of data, especially from sensors, wearable devices, and social media, anthropologists can use computational methods and data analysis to uncover common patterns of human behaviour and pinpoint interesting outliers. Quantitative methods have proven useful when dealing with large data sets. In such cases, an analysis without digital tools is virtually impossible, while visualisations offer new insight into the problem and help present the data concisely. In addition, quantitative approaches also increase the reproducibility of research.
3However, patterns emerging from such analysis can hardly ever be explained with data alone. We argue that data analysis can generate new hypotheses and research questions (Krieg et al. 2017) and provide a general overview of the topic. Conversely, ethnography substantiates analytical findings with the context and story behind the data. Going back and forth, from quantitative to qualitative methods and approaches, enables researchers to establish a research problem as suggested by the data, gauge new perspectives on the known problems, and account for outliers and patterns in the data. Circular research design enhances the quality of information, which does not have to derive solely from a quantitative or qualitative approach. By combining the two, we are using a research loop that ensures both sets of data get an additional perspective – quantitative data are verified with ethnography in the field, while ethnographic data become supported with statistically relevant patterns analysed by computational tools.
4Such methods are already, to a certain extent, employed in digital anthropology (Drazin 2012), but they are gaining more prominence in mainstream anthropology as well (Krieg et al. 2017). By establishing a solid methodological framework for quantitative analyses in relation to qualitative ones, we do not only strengthen the subfield of computational anthropology, but also provide new perspectives and research ventures to anthropology and emphasise its relevance for understanding lifestyles, habits, and practices in data-driven societies.
Sources and Literature
- Anderson, Ken, Dawn Nafus, Tye Rattenbury, and Ryan Aipperspach. 2009. “Numbers Have Qualities Too: Experiences with Ethno-mining.” Ethnographic Praxis in Industry Conference Proceedings 2009 (1): 123–40.
- Bell, Genevieve. 2006. “Satu keluarga, satu komputer (One Home, One Computer): Cultural Accounts of ICTs in South and Southeast Asia.” Design Issues 22 (2): 35–55.
- Blok, Anders, and Morten Axel Pedersen. 2014. “Complementary Social Science? Quali-quantitative experiments in a Big Data World.” Big Data & Society 1 (2): 1–6.
- Boellstorff, Tom. 2015. Coming of Age in Second Life: An Anthropologist Explores the Virtually Human. Princeton: Princeton University Press.
- Bonilla, Yarimar, and Jonathan Rosa. 2015. “#Ferguson: Digital Protest, Hashtag Ethnography, and the Racial Politics of Social Media in the United States.” American Ethnologist 42 (1): 4–17.
- boyd, danah, and Kate Crawford. 2012. “Critical Questions for Big Data: Provocations for a Cultural, Technological, and Scholarly Phenomenon.” Information, Communication & Society 15 (5): 662–79.
- Conte, Rosaria, Nigel Gilbert, Giulia Bonelli, Claudio Cioffi-Revilla et al. 2012. "Manifesto of Computational Social Science.” The European Physical Journal Special Topics 214 (1): 325-346.
- Creswell, John W., and Vicki L. Plano Clark. 2007. Designing and Conducting Mixed Methods Research. Thousand Oaks: Sage publications.
- Dave, Rajesh N. 1991. “Characterization and Detection of Noise in Clustering.” Pattern Recognition Letters 12 (11): 657–64.
- Dobbert, Marion Lundy, Dennis P. McGuire, James J. Pearson, and Kenneth Clarkson Taylor. 1984. “An Application of Dimensional Analysis in Cultural Anthropology.” American Anthropologist 86 (4): 854–84.
- Drazin, Adam. 2012. “Design Anthropology: Working on, with and for Digital Technologies.” In Digital Anthropology, edited by Heather A. Horst and Daniel Miller, 245–65. London and New Yourk: Berg.
- Fayyad, Usama M., Andreas Wierse, and Georges G. Grinstein, eds. 2002. Information Visualization in Data Mining and Knowledge Discovery. San Francisco: Morgan Kaufmann.
- Floridi, Luciano and Taddeo, Mariarosaria. 2016. “What is data ethics?” Philosophical Transactions A: 374: 1–5.
- Gershenfeld, Neil, and J. P. Vasseur. 2014. “As Objects go Online: The Promise (and Pitfalls) of the Internet of Things.” Foreign Affairs 93: 60.
- Halford, Susan. 2017. “The Ethical Disruptions of Social Media Data: Tales from the Field.” In The Ethics of Online Research, 13–25. Bingley: Emerald Publishing Limited.
- Hockey, Susan. 2004. “The History of Humanities Computing.” A Companion to Digital Humanities, 3–19.
- Hsu, Wendy F. 2014. “Digital Ethnography Toward Augmented Empiricism: A New Methodological Framework.” Journal of Digital Humanities 3 (1): 1–19.
- Jänicke, Stefan, Greta Franzini, Muhammad Faisal Cheema, and Gerik Scheuermann. 2015. “On Close and Distant Reading in Digital Humanities: A Survey and Future Challenges.” In Eurographics Conference on Visualization (EuroVis)-STARs. The Eurographics Association.
- Johnson, R. Burke, Anthony J. Onwuegbuzie, and Lisa A. Turner. 2007. “Toward a Definition of Mixed Methods Research.” Journal of Mixed Methods Research 1 (2): 112–33.
- Kawulich, Barbara. 2005. “Participant Observation as a Data Collection Method.” In Qualitative Sozialforschung / Forum: Qualitative Social Research 6 (2).
- Klein, Lauren F., and Matthew K. Gold. 2016. “Digital Humanities: The Expanded Field.” Debates in the Digital Humanities.
- Krieg, Lisa Jenny, Moritz Berning, and Anita Hardon. 2017. “Anthropology with Algorithms? An Exploration of Online Drug Knowledge Using Digital Methods.” Issues 5 (2).
- Kuzara, Richard S., George R. Mead, and Keith A. Dixon. 1966. “Seriation of Anthropological Data: A Computer Program for Matrix-ordering.” American Anthropologist 68 (6): 1442–55.
- Lum, Kristian, and William Isaac. 2016. “To predict and serve?” Significance 13: 14–19.
- Malinowski, Bronislaw. 2002 [1922]. Argonauts of the Western Pacific: An Account of Native Enterprise and Adventure in the Archipelagoes of Melanesian New Guinea. London: Routledge.
- Marcus, George E. 2007. “Ethnography Two Decades after Writing Culture: From the Experimental to the Baroque.” Anthropological Quarterly 80 (4): 1127–45.
- Markham, Annette, Elizabeth Buchanan, and AoIR Ethics Working Committee. 2012. Ethical Decision-making and Internet Research: Version 2.0. Association of Internet Researchers.
- Marx, Gary T. 2002. “What’s New about the ‘New Surveillance’? Classifying for Change and Continuity.” Knowledge, Technology & Policy 17 (1): 18–37.
- Miller, Daniel, Elisabetta Costa, Nell Haynes, Tom McDonald, Razvan Nicolescu, Jolynna Sinanan, Juliano Spyer, Shriram Venkatraman, and Xinyuan Wang. 2016. How the World Changed Social Media. London: UCL press.
- Mitchell, J. Clyde. 1974. “Social Networks.” Annual Review of Anthropology 3: 279–99.
- Mittelstadt, Brent Daniel, Patrick Allo, Mariarosaria Taddeo, Sandra Wachter, and Luciano Floridi. 2016. “The Ethics of Algorithms: Mapping the Debate.” Big Data & Society 3 (2): 1–21.
- Nardi, Bonnie. 2010. My Life as a Night Elf Priest: An Anthropological account of World of Warcraft. University of Michigan Press.
- Nolan, Cathy. 2018. “Data Surveillance, Monitoring, and Spying: Personal Privacy in a Data-Gathering World.” Data Topics. Published May 2, 2018. https://www.dataversity.net/data-surveillance-monitoring-spying-personal-privacy-data-gathering-world/.
- Patel, Shyamal, Hyung Park, Paolo Bonato, Leighton Chan, and Mary Rodgers. 2012. “A Review of Wearable Sensors and Systems with Application in Rehabilitation.” Journal of Neuroengineering and Rehabilitation 9 (1): 21.
- Pink, Sarah, Shanti Sumartojo, Deborah Lupton, and Christine Heyes La Bond. 2017. “Mundane Data: The Routines, Contingencies and Accomplishments of Digital living.” Big Data & Society 4 (1): 1–12.
- Podolefsky, Aaron, and Christopher McCarty. 1983. “Topical Sorting: A Technique for Computer Assisted Qualitative Data Analysis.” American Anthropologist 85 (4): 886–90.
- Pretnar, Ajda, and Marko Robnik-Šikonja. 2019. “Analiza slik in besedil s pristopi umetne inteligence.” Glasnik SED 59 (1): 49–57.
- Ramos, Mary Carol. 1989. “Some Ethical Implications of Qualitative Research.” Research in Nursing & Health 12 (1): 57–63.
- Shearer, Colin. 2000. “The CRISP-DM Model: the New Blueprint for Data Mining.” Data Warehousing 5: 13–22.
- Skeem, Jennifer L., and Christopher Lowenkamp. 2016. “Risk, Race, & Recidivism: Predictive Bias and Disparate Impact.” Criminology: An Interdisciplinary Journal 54 (4): 680–712.
- Svensson, Patrik. 2010. “The Landscape of Digital Humanities.” Digital Humanities. http://digitalhumanities.org/dhq/vol/4/1/000080/000080.html.
- Teddlie, Charles, and Abbas Tashakkori. 2009. Foundations of Mixed Methods Research: Integrating Quantitative and Qualitative Approaches in the Social and Behavioral Sciences. Los Angeles: Sage.
- White, Douglas R., and Gregory F. Truex. 1988. “Anthropology and Computing: The Challenges of the 1990s.” Social Science Computer Review 6 (4): 481–97.
- Personal archive.
Ajda Pretnar, Dan Podjed
Data Mining Workspace Sensors: A New Approach to Anthropology
Summary
1With an increasing availability of data coming from social networks and wearable devices among other sources, anthropologists can easier than ever dive into data analysis and study humans and their societies, subcultures and cultures quantitatively as well as qualitatively. In this contribution we extend the interdisciplinarity of anthropology by employing circular mixed methods that combine qualitative (ethnographic) approaches with quantitative approaches from data mining and machine learning.
2The research, which is the basis for this contribution, began in October 2017 and includes 14 workspaces of one of University of Ljubljana's buildings. For the purpose of our study, we designed a novel methodological approach and named it circular mixed methods. We employed it to analyse workspace behaviours and practices of employees and to develop sustainable solutions for encouraging a healthy lifestyle.
3As we explain in the contribution, circular mixed methods are appropriate for uncovering detailed longitudinal patterns, which are impossible to detect manually. The suggested approach is effective for analysing diachronic phenomena, where we retrieve the data from several locations at once, thus overcoming the physical limitations of individual researchers. Finally, using this methodology, researchers can effectively and rapidly analyse large data collections. Some such collections are interesting for anthropologists as well, namely social media, archival data, wearables, sensors or audio-visual recordings.
4While quantitative analysis helps us generate hypotheses and uncover patterns in the data, qualitative approaches, such as ethnography and fieldwork, explain those patterns and substantiate data with rich details. Combining the two approaches, we can interpret the data in a contextually rich and anthropologically relevant way.
Ajda Pretnar, Dan Podjed
Podatkovno rudarjenje senzorjev v delovnem okolju: nov pristop k antropologiji
Povzetek
1Z vse večjo množico podatkov, pridobljenih, med drugim, z družbenih omrežij in pametnih naprav, lahko antropologi lažje kot kadarkoli prej pri raziskovanju uporabijo podatkovno analitiko in preučujejo ljudi in njihove navade ter kulture in podkulture, in to tako s kvantitativnega kot kvalitativnega vidika. V prispevku razširimo idejo interdisciplinarnosti v antropologiji z uporabo krožnih mešanih metod, ki povezujejo kvalitativne (etnografske) pristope s kvantitativnimi pristopi rudarjenja podatkov in strojnega učenja.
2Raziskava, ki je podlaga pričujočega prispevka, se je začela oktobra 2017 in vključuje 14 delovnih prostorov ene od stavb Univerze v Ljubljani. Za vzpostavljanje novih pogledov na navade ljudi v stavbi in snovanje potencialno relevantnih hipotez smo uporabili krožne mešane metode, s katerimi smo analizirali vedenje in prakse ter na podlagi le-teh razvili celostne rešitve za spodbujanje zdravega načina življenja in izboljšanje počutja na delovnem mestu.
3Kot pojasni prispevek, so krožne mešane metode najprimernejše za odkrivanje podrobnih in dolgotrajnih vzorcev, ki jih raziskovalec ne more sam opazovati in zaznati. Pristop je učinkovit tudi za opazovanje sočasnih dogodkov, kjer podatke hkrati pridobimo z več lokacij, s čimer presežemo raziskovalčeve fizične omejitve. Poleg tega je metodologija uporabna za učinkovito in hitro analizo velikih podatkovnih zbirk, med katerimi so za antropologe posebej zanimivi podatki z družbenih omrežij, pametnih naprav in senzorjev, avdio-vizualno gradivo ter digitalizirani arhivski viri.
4Medtem ko kvantitativna analiza omogoča postavitev hipotez in odkrivanje vzorcev v podatkih, jih kvalitativne metode, zlasti etnografija in opazovanje na terenu, razložijo in obogatijo s podrobnostmi. Kombinacija obeh pristopov zagotavlja, da podatke interpretiramo na vsebinsko bogat in antropološko relevanten način.
* Laboratory of Bioinformatics, Faculty of Computer and Information Science, University of Ljubljana, Večna pot 113, SI-1000 Ljubljana, ajda.pretnar@fri.uni-lj.si
** Institute of Slovenian Ethnology, Research Centre of the Slovenian Academy of Sciences and Arts, Novi trg 2, SI-1000 Ljubljana, dan.podjed@zrc-sazu.si
1. Anthropology is considered a part of the humanities in the Slovenian academic tradition, while elsewhere it is placed under the umbrella of social sciences. In reality, it probably lies at the intersection of both.
2. Standby is activated on workdays as a transitory setting between night and comfort regime.
3. 1 would mean the room was always occupied and 0 that the room was never occupied at a specific time of the day.
4. For concealing the actual identity of the people participating in the study, the pronoun he is used to denote both males and females.